March 30, 2024
What Should Every Forex Trader Learn? Six Types of Technical Analysis
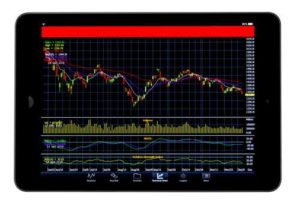
Forex indicators operate as tools that are braced in trading platforms. They offer traders a different perspective of the market. They may show you a look back on historical data, a view of the current state of the currency pair, or short or long-term forecasts.
Oscillators
Forex oscillators are designed to indicate the market’s limit reaching moments. Let’s talk about some examples to better understand the concept of this tool. Analysts say that it is overbought when the price goes very high. It means that the price will slide down a little bit or stay stable as traders try to increase their profits.
When a negative correction takes place, the market is occupied by the new traders, who raise the price. However, an oversold market causes a positive correction or the other direction’s reaction. You can also use an Oscillator to forecast a breaking point of the market’s price movement.
Moving Averages
Moving Averages are one of the best technical indicators which are designed to indicate breaks in price actions. They have a form of the line which can tell us the average value of a forex pair for the pacific period of time, for example, ten or a hundred days. By looking at them the trader will have a general idea of the trend of the currency pair, but it is noteworthy that over a smaller period of time, price changes in the market will affect moving averages faster.
Moving averages are more stable indicators than other tools on the market. In fact, they are more beneficial in long-term time frames. On the other hand, moving averages are slow when it comes to responding to fast-changing market conditions, as they are based on historical data. It means that the traders who work shorter time frames may not find it very useful.
Some professional traders even have the favorite indicator which is used most frequently by them and their whole strategy is dependent on them. Despite the fact that Forex indicators are one of the most important tools for successful trading, relying on only one indicator is not the right approach. If you are a complete beginner you can use this article as a guide to moving averages indicator. There are various Forex indicators and the basic six types are listed below.
Stochastic
Stochastics are designed to show oversold and overbought conditions and it is also very good in pointing out possible price reversals. There are various versions of stochastics and slow stochastics are most commonly used. They are made with two moving averages which change between hundred and zero. The findings of Stochastics are very accurate and that makes them a favorite indicator for many traders.
Stochastics offer clear trading signals which are very useful in the trading process. They are easy to read and understand which is another reason for their popularity with the traders who take their first steps. On the other hand, Stochastic may not be very useful for traders who work on short-time deals and it is also noteworthy that sometimes they produce false signals.
Fibonacci Retracement Lines
As you may have already guessed, Fibonacci Retracement Lines are based on the Fibonacci sequence and it is designed to find resistance levels and support on a trading instrument. Fibonacci Retracement is a significant part of forex trade evaluations and because of that prices experience extensions and retracements that generally align with the theory. It has a long history in forex trading and many successful traders have confirmed that Fibonacci Retracement is a very useful tool.
On the other hand, Fibonacci Retracements contain subjective evaluation. Many critics think that retracement levels become a self-fulfilling prophecy as they are universally used.
Relative Strength Index
RSI is very much like Stochastics as they are designed to find market conditions that are overbought or oversold. Values are plotted between hundred and zero and it makes the Relative Strength Index very useful for the traders who want to buy things cheap and sell them for high value. One of the most important qualities of RSI is that you can set an alert that notifies you when a currency pair’s value increases to a certain level. However, RSI is more useful at the starting point of trade evaluations as it gives false signals pretty often.
Bollinger Band
Bollinger Band basically is a volatility channel that is featured on lists detailing Forex indicators. They are widely used because they are easy to understand. It easily visualizes the volatility of the market: If there is a narrow distance between two outer bands it means that there may be a price breakout but if the distance is wide it means that market volatility has increased.
On the other hand, Bollinger Band is based on past information which makes indicating opportunities earlier difficult. This means that Bollinger Band is much more useful when it is paired with other tools.
 October 1, 2019