What Are The Best Financial Trading Indicators That Won’t Clutter Your Chart?
Technical traders use a variety of tools, including trading indicators. Price patterns may be better understood when you have the appropriate risk management solutions in place.
Regardless of whether you trade forex, commodities, or stocks, using technical analysis as part of your strategy may be beneficial. This involves researching different trading indicators. There are mathematical computations used to create trading indicators, which are then displayed as lines on a price chart to assist traders in identifying market signals and trends.
Some trading indicators are leading, while others are lagged, such as stochastic oscillators (STO). There are two types of indicators: one looks forward and forecasts future price changes, while the other looks back and shows momentum.
Market psychology and supply and demand may be better understood with the use of technical indicators. Technical analysis is built on a foundation of indications like these. Statistics like trade volume reveal if a price trend will persist or not. Indicators may produce buy and sell signals in this manner.
Even if there are several excellent indicators used in financial trading, your chart may be cluttered with them. So, which financial trading indicators are the most reliable?

Moving Average
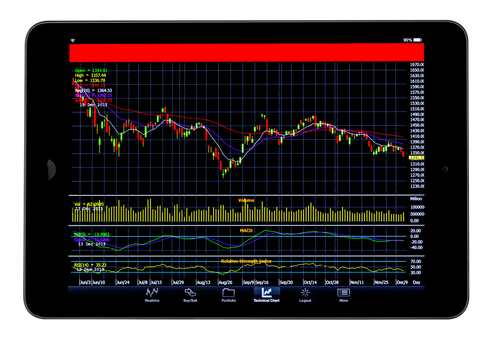
The moving average is a widely used technical indicator for spotting trends. The moving average calculation is one of the most widely utilized methods for spotting new and recurrent trends (MA). The MA is a mathematical method for calculating averages and spotting patterns in data. The MA, which is a part of the top MT4 indicators list, is a technical indicator that traders use to identify new and recurring market trends. Using data to identify patterns and smooth out market movement, this mathematical method finds averages and removes “noise” from random fluctuations.
When it comes to stock market research, a 50- or 200-day moving average is most frequently used to identify market trends and predict where stocks will go next. Using a moving average in trading, which is also one of the best trading indicators for MT5, has many benefits and can be customized to fit any time period. To offer support in an upswing, a moving average may be employed as a base ground or support. Moving averages may serve as ‘ceilings’ or resistance in a downturn. This may be crucial for technical analysis methods, and the combination of different approaches can lead to both long-term and short-term predictions. If you know the formula for calculating MAs, you may utilize them in any chart analysis that calls for them.
MAs, as previously mentioned, may be used to assess the strength of support and opposition within a group. Technical analysis may be aided with charts, which include moving averages (MAs) as well as other tools like Bollinger bands and the relative strength index (RSI).
Moving Average Convergence Divergence (MACD)
An indicator for technical analysis, the moving average convergence/divergence (MACD) seeks to detect changes in the price momentum of a stock. The MACD is a technical indicator that gathers data from several moving averages to aid traders in spotting potential buying and selling opportunities.
When two moving averages converge, it indicates they’re becoming closer together; when they diverge, it means they’re getting further apart.
Because it’s easy and dependable, the MACD indicator is very popular. There are two reasons for its popularity: the strength of the trend and the moment at which it begins to reverse.
To create buy and sell signals, traders may employ a basic moving average technique, however, this gauge might be delayed, meaning market circumstances can alter before the transaction is completed. As a result, the moving average convergence/divergence indicator is well-liked since it accurately depicts current market conditions.
The MACD has certain limitations, just like any other technical analysis indicator, and it should be used in conjunction with other tools.
The MACD has the disadvantage of being a short-term indicator since it only considers the 26-day moving average. The MACD may not be appropriate for traders with a longer-term view.
Instead of giving indications before a trend begins, the indicator does so as the trend happens. There is no better indicator than the MACD for spotting an impending trend.
Bollinger Bands
Bollinger Bands, and the main tools generated from them (percent B and Bandwidth), may be used to help identify patterns in the market, construct robust trading systems, develop individualized analytical methods for financial markets, and much more.
A moving average or other central tendency metric is used to construct trading bands, whereas an envelope takes in the whole price structure without focusing on a single point. Various band and envelope designs have been used throughout time, with some continuing in use today.
When using Bollinger Bands, traders may determine if prices are high or low by looking at the curves formed around the price structure, which often include a moving average (the middle band), an upper band, and a lower band.
Bollinger Bands are highly adaptable in terms of practical use. Bollinger Bands are nothing more than a tool at the end of the day. Creating your own trading methods and approaches is possible with the help of these resources.


